2025年雅思写作预测大题库限时免费领取,想要领取的同学可以戳:
2025年雅思写作预测大题库&范文领取!你将遇到的99%纸笔/机考原题都在其中!
情报圈的第789篇写作范文解析
表格题
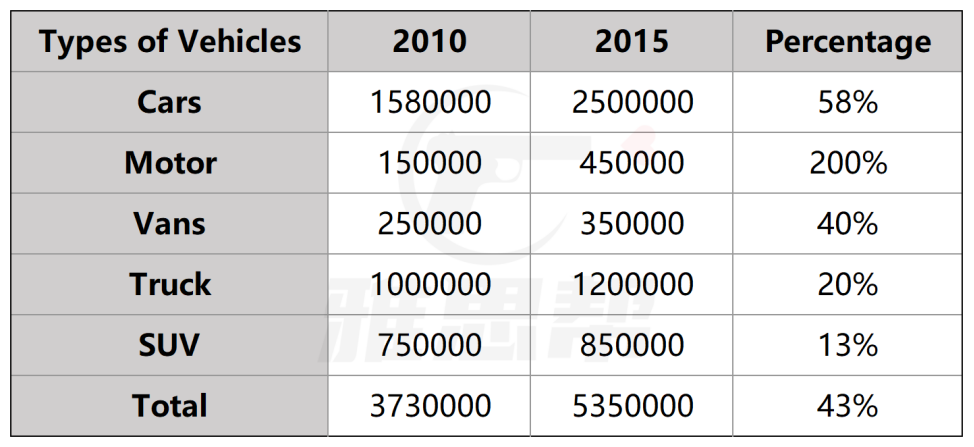
The table shows five types of registered motor vehicle in Australia in 2010 and 2015, with the change of percentage over these five years.
Summarise the information by selecting and reporting the main features, and make comparisons where relevant.

题目来源:2025年4月19日大陆雅思小作文
1、题目大意
该表显示了2010年和2015年澳大利亚注册的五种机动车数量,以及这五年中的增长比。
通过选择和报告主要特征来总结信息,并在相关情况下进行比较。
2、高分范文示例
开始段 - 改写题目+总结
The table illustrates changes in the number of vehicles in Australia across five categories - Cars, Motorcycles, Vans, Trucks, and SUVs - between 2010 and 2015. Overall, all vehicle types saw an increase over the five-year period, with Motorcycles showing the greatest growth and SUVs experiencing the smallest rise.
第一段 - 总数增长
As indicated, the total number of vehicles rose significantly from 3.73 million in 2010 to 5.35 million in 2015, representing an overall growth rate of 43%. Among all vehicle categories, Cars and Trucks had the highest numbers. Specifically, the number of Cars increased substantially by 58%, from 1.58 million to 2.5 million, while Trucks grew moderately by 20%, from 1 million to 1.2 million vehicles.
第二段 - 数量较少的三类
Meanwhile, Motorcycles experienced the most significant growth of 200%. Although starting at just 150,000 vehicles in 2010, this category surpassed Vans by 2015, reaching 450,000 units. Vans, despite a 40% increase from 250,000 to 350,000 vehicles, remained the least common category by 2015. SUVs had the lowest growth rate, rising by only 13%, from 750,000 to 850,000 vehicles over the same period.
必备语料
vehicle categories 车辆类别
experienced the greatest growth 经历最大增长
showed the smallest rise 呈现最小增幅
rose significantly 显著增加
an overall growth rate of 总体增长率为
increased substantially 大幅增长
grew moderately 适度增长
surpassed by 超过了
the least common category 数量最少的类别
over the same period 在同期内
fell to 下降到
the lowest among 在……中最低


